
What This Is: A complete playbook to calculate your revenue per employee, benchmark against industry leaders, and make data-driven hiring decisions. Every hire should pass the RPE test before you commit.
warningWhy You Need This
Most founders hire reactively: "We're overwhelmed, we need more people." But more people often means more complexity, higher costs, and lower efficiency. MailChimp built a $12B company by obsessing over RPE — revenue per employee.
This playbook forces you to ask: "Will this hire actually improve our efficiency, or just dilute it?" Five steps from calculator to quarterly tracker.
checklistHow to Use This Playbook
- counter_1
Calculate Your Current RPE: Establish your baseline — both basic and fully loaded.
- counter_2
Benchmark Against Your Industry: See how you compare to healthy and world-class ranges.
- counter_3
Model New Hires: Use the ROI calculator to predict impact before you sign an offer.
- counter_4
Apply the Decision Framework: Run every hire through 4 questions before committing.
- counter_5
Improve Systematically: Pull the levers that match your situation — from pricing to automation.
- counter_6
Track Quarterly: Monitor RPE trends to stay on top of efficiency.
timelinePlaybook Steps (In Order)
- counter_1
Step 1: RPE Calculator — Establish your baseline and benchmark.
- counter_2
Step 2: Hiring ROI Calculator — Model the impact of any hire before you commit.
- counter_3
Step 3: Hiring Decision Framework — 4 questions every hire must answer.
- counter_4
Step 4: RPE Improvement Playbook — Levers to pull + the MailChimp playbook.
- counter_5
Step 5: RPE Quarterly Tracker — Track trends and catch red flags.
calculateRPE Calculator & Industry Benchmarks
Start here. Calculate both your basic RPE and your fully loaded RPE (including contractors and agencies), then compare against industry standards.
| Industry | Healthy Range | World-Class |
|---|---|---|
| Service Businesses | $100,000–$150,000 | $200,000+ |
| SaaS (early stage) | $150,000–$250,000 | $350,000+ |
| SaaS (mature) | $200,000–$300,000 | $500,000+ |
| E-commerce | $200,000–$400,000 | $600,000+ |
| Software / Tech Products | $300,000–$500,000 | $700,000+ |
| Content / Media | $100,000–$200,000 | $300,000+ |
person_addHiring ROI Calculator
Before you hire, run the numbers. Model three scenarios — revenue-adding hire, efficiency hire, and automation alternative — to see the real impact on RPE and profit.
gavelHiring Decision Framework
Four questions that every proposed hire must answer before you commit. Includes automation-first checks and clear go / pause / stop criteria.
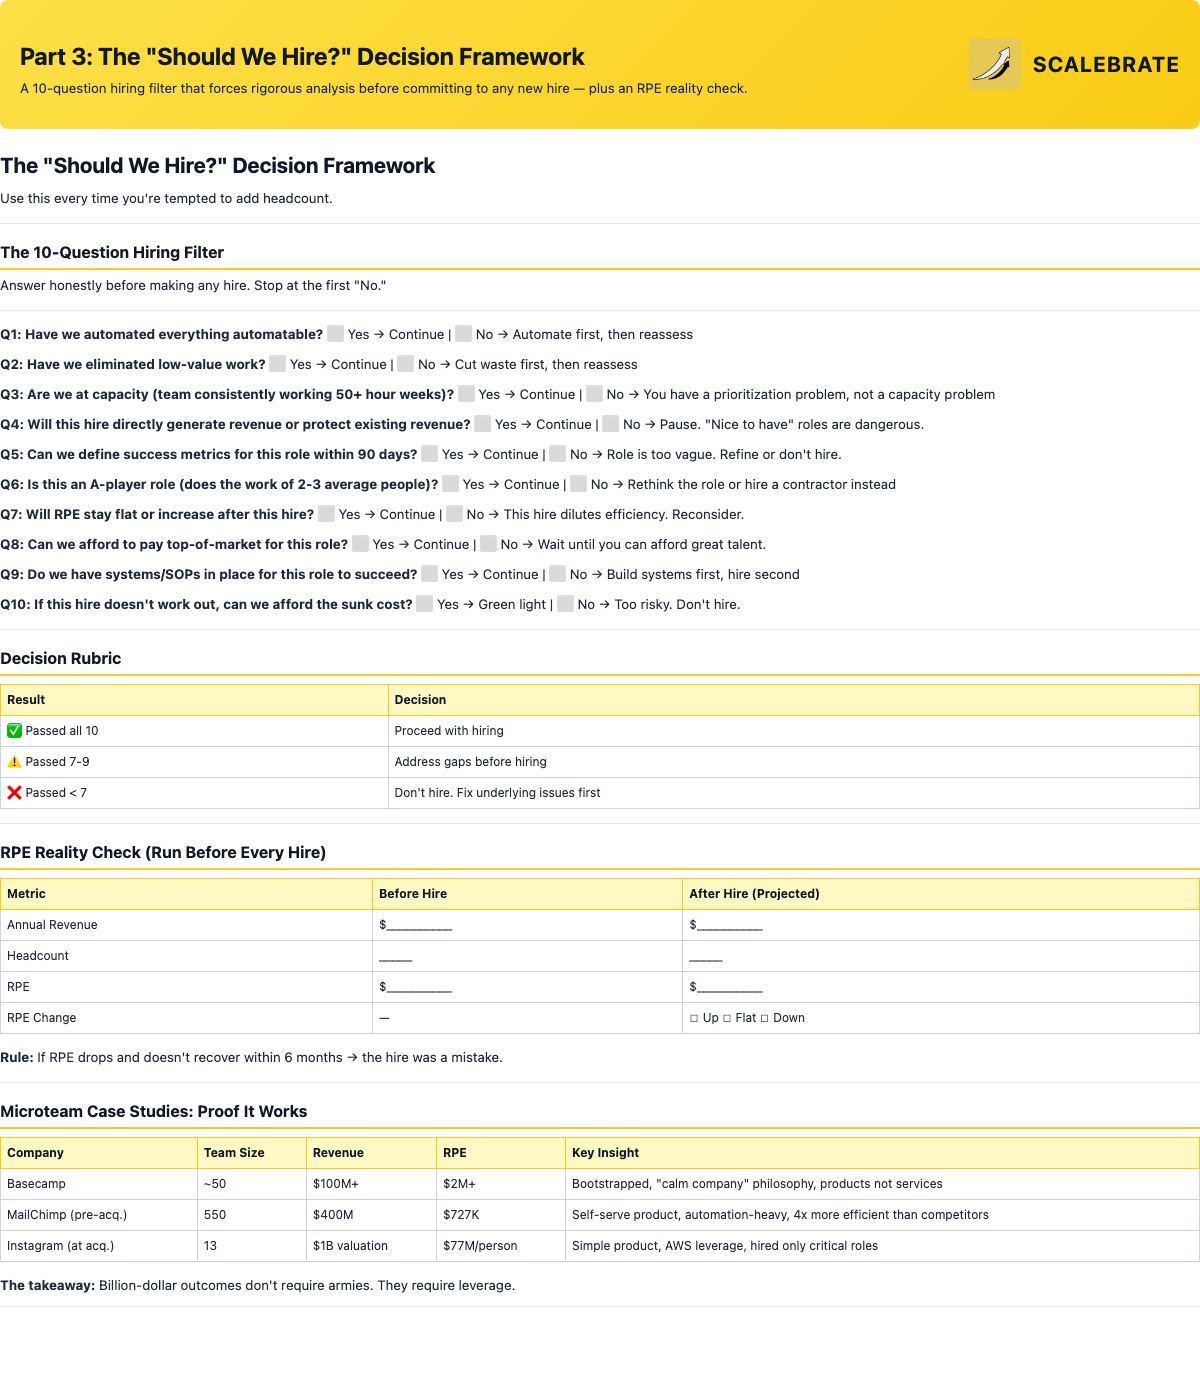
Run every hire through 4 questions — including the automation-first checklist.
rocket_launchRPE Improvement Playbook
Four levers to pull — from raising prices to automating low-value work — plus the specific strategies MailChimp used to reach $727K RPE while staying bootstrapped.
rocket_launchRPE Improvement Playbook
RPE Improvement Playbook
How to increase RPE without just adding people.
Lever 1: Increase Revenue (Keep Headcount Flat)
- chevron_right
Raise prices (easiest, fastest lever)
- chevron_right
Upsell / cross-sell existing customers
- chevron_right
Add higher-margin products or services
- chevron_right
Improve conversion rates (more revenue from same traffic)
Example: 8 people, $1.2M revenue → Raise prices 15% → $1.38M revenue, same headcount → RPE jumps from $150K to $172.5K (+15%)
Lever 2: Automate Low-Value Work
- chevron_right
Replace manual tasks with AI workflows
- chevron_right
Use no-code tools instead of hiring developers
- chevron_right
Implement self-service for customers (reduce support load)
- chevron_right
Automate reporting, data entry, and scheduling
Example: Automate customer onboarding (saves 15 hrs/week) → Team takes on 2 more clients without adding headcount
Lever 3: Reduce Headcount (When Warranted)
Consider when:
- chevron_right
RPE is below industry benchmarks
- chevron_right
You have "nice to have" roles that don't drive revenue
- chevron_right
Overlap between roles (two people doing similar work)
Lever 4: Improve Team Productivity
- chevron_right
Better tools (give team force multipliers)
- chevron_right
Clearer processes (reduce wasted time)
- chevron_right
Eliminate low-value work (meetings, reports nobody reads)
- chevron_right
Hire A players instead of B players — one great person > two mediocre people
The MailChimp Playbook ($727K RPE)
Strategy 1: Self-Serve Product — Build a product so intuitive that customers don't need sales calls or onboarding help. Invest in UX, not customer success headcount.
Strategy 2: Automation Over Headcount — Automate support with robust docs and chatbots. Only hire when automation can't solve the problem.
Strategy 3: High-Value Roles Only — No middle management. No "nice to have" roles. Every role directly serves customers or builds product.
Strategy 4: Stay Bootstrapped — Make hiring decisions based on ROI, not fundraising pressure. Optimize for profit per employee, not vanity metrics.
bar_chartRPE Quarterly Tracker
Track your RPE quarter by quarter. If it's trending down for two consecutive quarters, something is wrong — this tracker makes the signal impossible to miss.
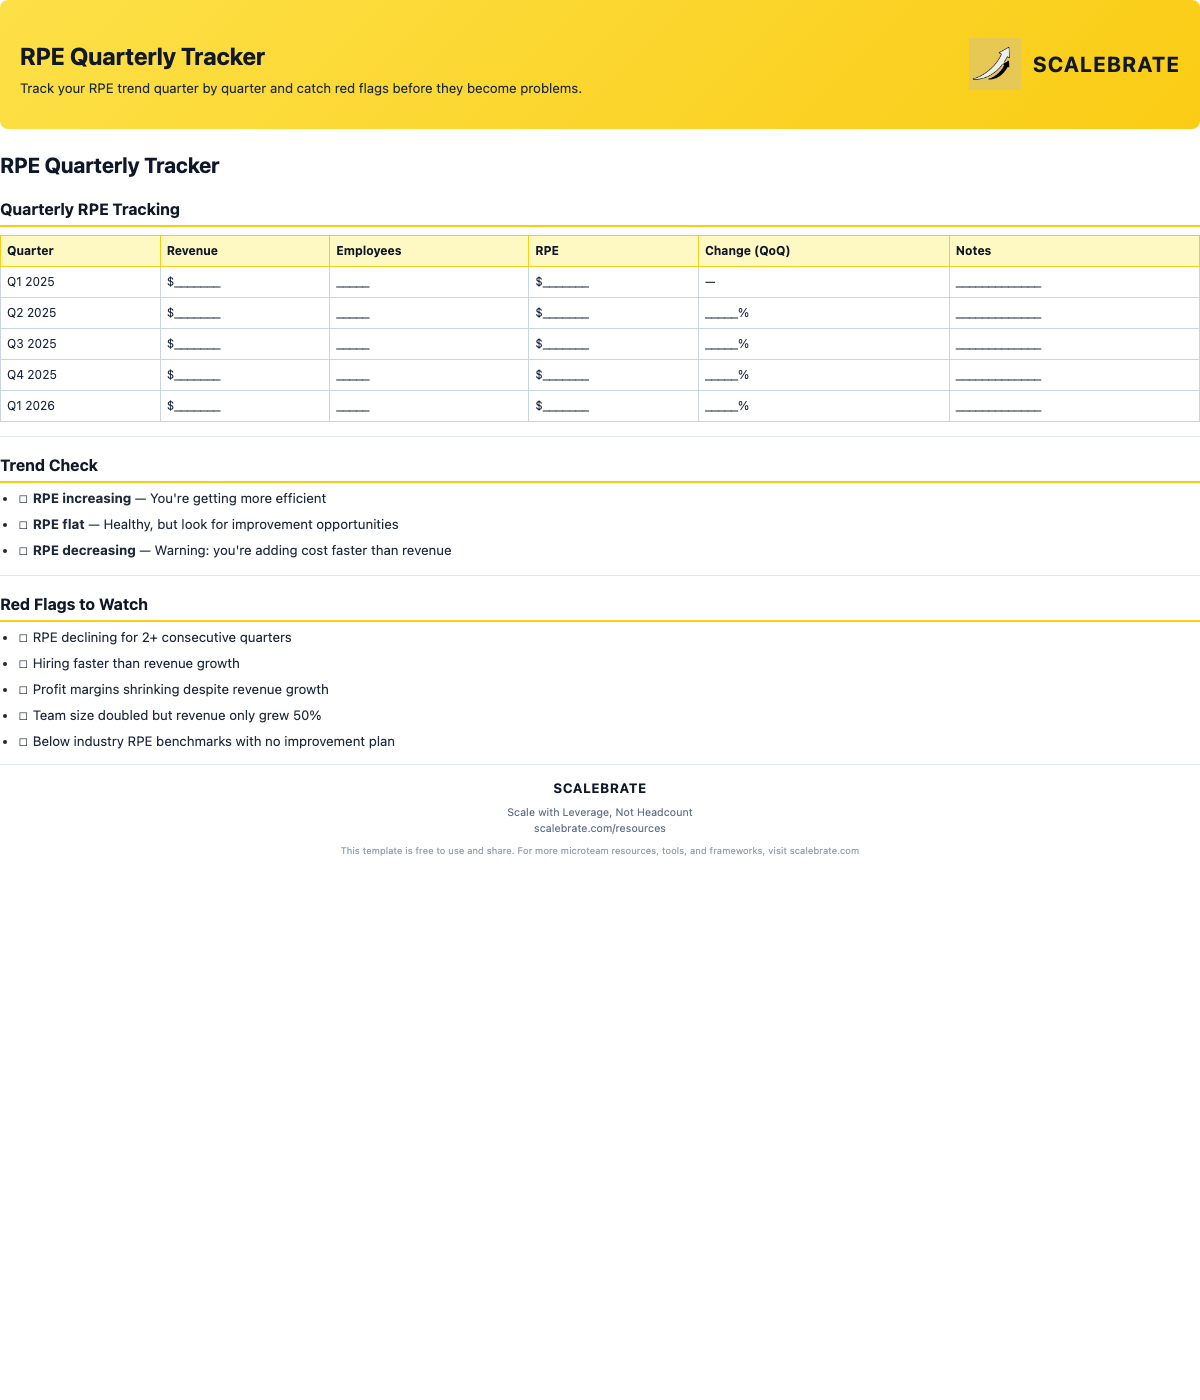
Track RPE trends and watch for the five red flags that signal trouble.
history_eduExample: How DevFlow Improved RPE by 67%
Company: DevFlow (developer tools SaaS) Timeline: 18 months
Starting Point: $1.8M revenue, 15 employees, $120K RPE — below the $200K+ benchmark.
- chevron_right
Q1: Automated support with AI chatbot + better docs → reduced support team from 3 to 1. Automated admin → eliminated that role.
- chevron_right
Q2: Raised prices 20% (from $49 to $59/month). Hired 1 senior engineer to replace 2 junior engineers.
- chevron_right
Q3: Launched self-serve onboarding. Implemented product-led growth.
Results: Revenue $2.4M (+33%), Employees 12 (−20%), RPE $200K (+67%), Profit margin 22% → 35%.
Tip 1: Track RPE Alongside Profit Margin — High RPE doesn't matter if you're not profitable. Optimize for both.
Tip 2: Compare to Your Past Self, Not Just Benchmarks — Going from $100K to $150K RPE is great progress even if the benchmark is $200K. Trend matters more than absolute number.
Tip 3: Use RPE to Negotiate With VCs — If investors pressure you to hire aggressively, show them your RPE. "We're at $300K. Hiring 10 people would drop that to $180K. Let's grow sustainably."