
What This Is: A plug-and-play finance dashboard that tracks all 10 critical money skills in one place. See your financial health at a glance and catch problems before they become crises.
warningWhy You Need This
You can't master money skills you're not measuring. Most founders have financial data scattered across bank accounts, Stripe dashboards, spreadsheets, and their accountant's software.
This dashboard consolidates everything into one system. Set it up once, import data monthly in 10 minutes, and run a 15-minute review on the 1st of every month.
checklistHow to Use This Playbook
- counter_1
Start with the Snapshot: Get your baseline numbers and key financial ratios into Step 1.
- counter_2
Fill Revenue & Margin: Track profit margin monthly and run your pricing calculator in Step 2.
- counter_3
Monitor Cash & Unit Economics: 13-week forecast, per-project margins, and burn rate in Step 3.
- counter_4
Watch Customer Health: Budget vs. actual, concentration risk, and AR aging in Step 4.
- counter_5
Run the Monthly Review: 15-minute scorecard on the 1st — plus automation recipes to keep it running.
timelinePlaybook Steps (In Order)
- counter_1
Step 1: Financial Snapshot & Key Ratios — Your command center. All metrics in one view.
- counter_2
Step 2: Revenue, Margin & Pricing — Profit margin, RPE, and what you should be charging.
- counter_3
Step 3: Cash Flow, Unit Economics & Burn Rate — 13-week forecast, per-project profitability, runway.
- counter_4
Step 4: Budget, Customer Risk & AR Aging — Where money goes, concentration risk, and collections.
- counter_5
Step 5: Monthly Money Skills Review — Score all 10 skills and set next month's priorities.
dashboardFinancial Snapshot & Key Ratios
Your command center. All 10 key metrics in one table, plus the 5 financial ratios that tell you whether the business is structurally healthy.
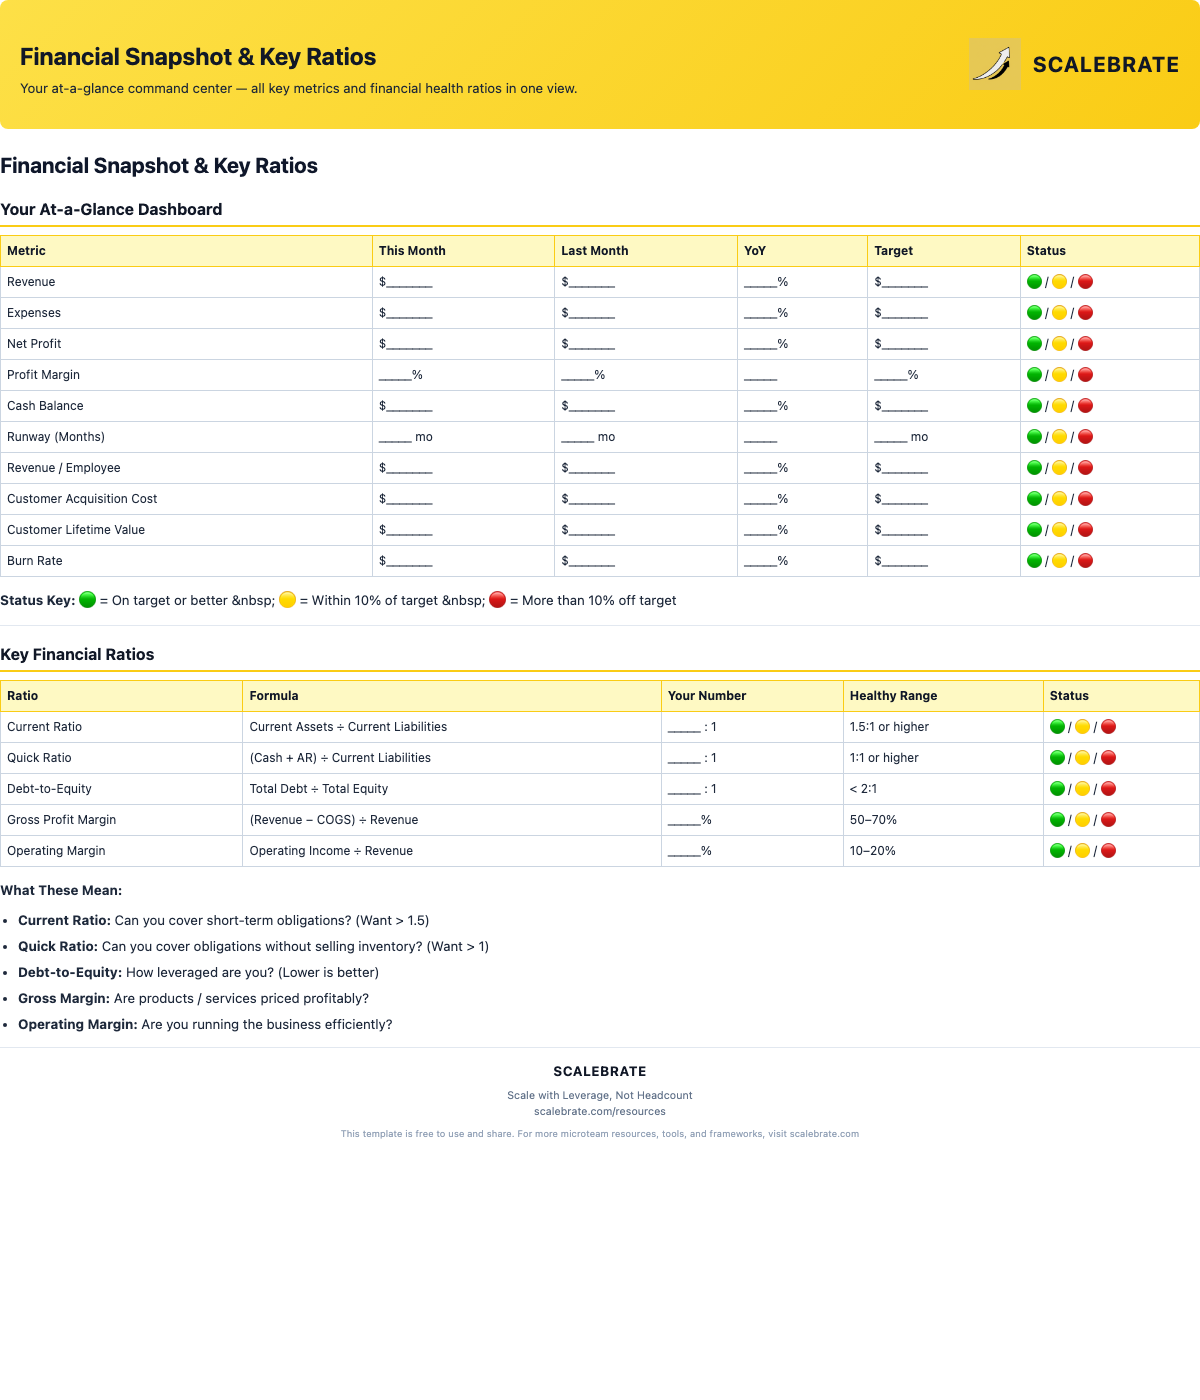
All key metrics and financial ratios in one at-a-glance view.
trending_upRevenue, Margin & Pricing Tracker
Month-by-month profit margin tracking, revenue per employee benchmarking, and a pricing calculator that tells you exactly what you should be charging.
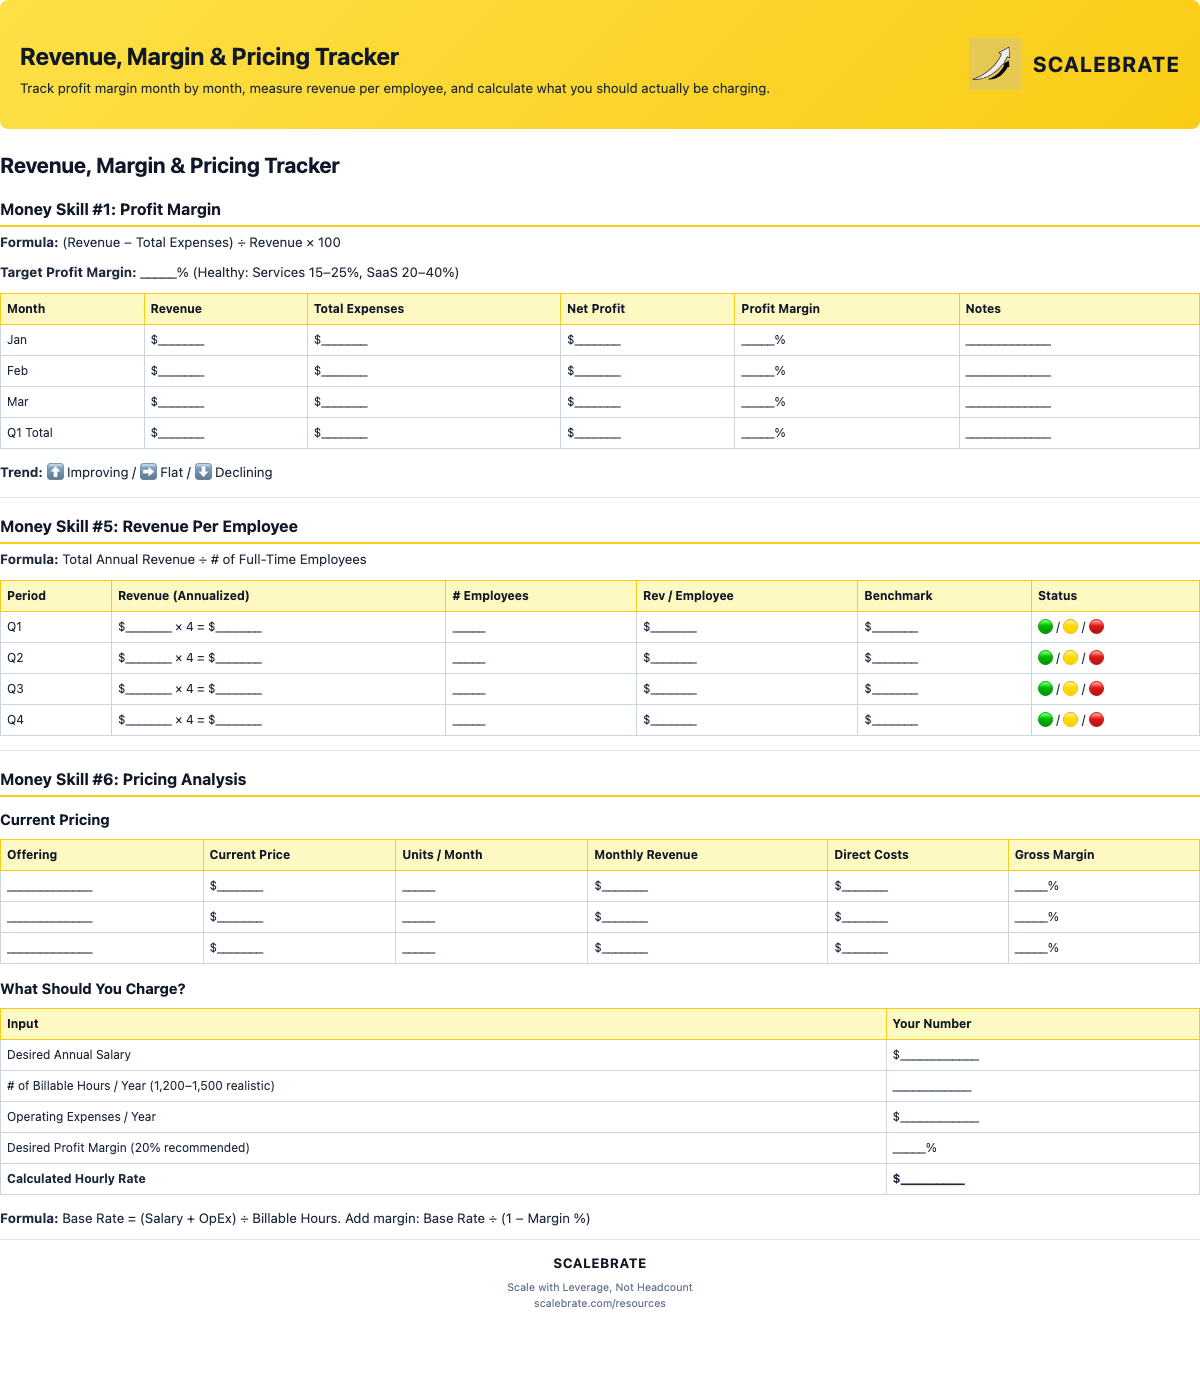
Track profit margin trends and run your pricing calculator.
account_balanceCash Flow, Unit Economics & Burn Rate
Three money skills in one tracker: a 13-week cash forecast, per-project unit economics (services and SaaS), and burn rate with runway calculation.
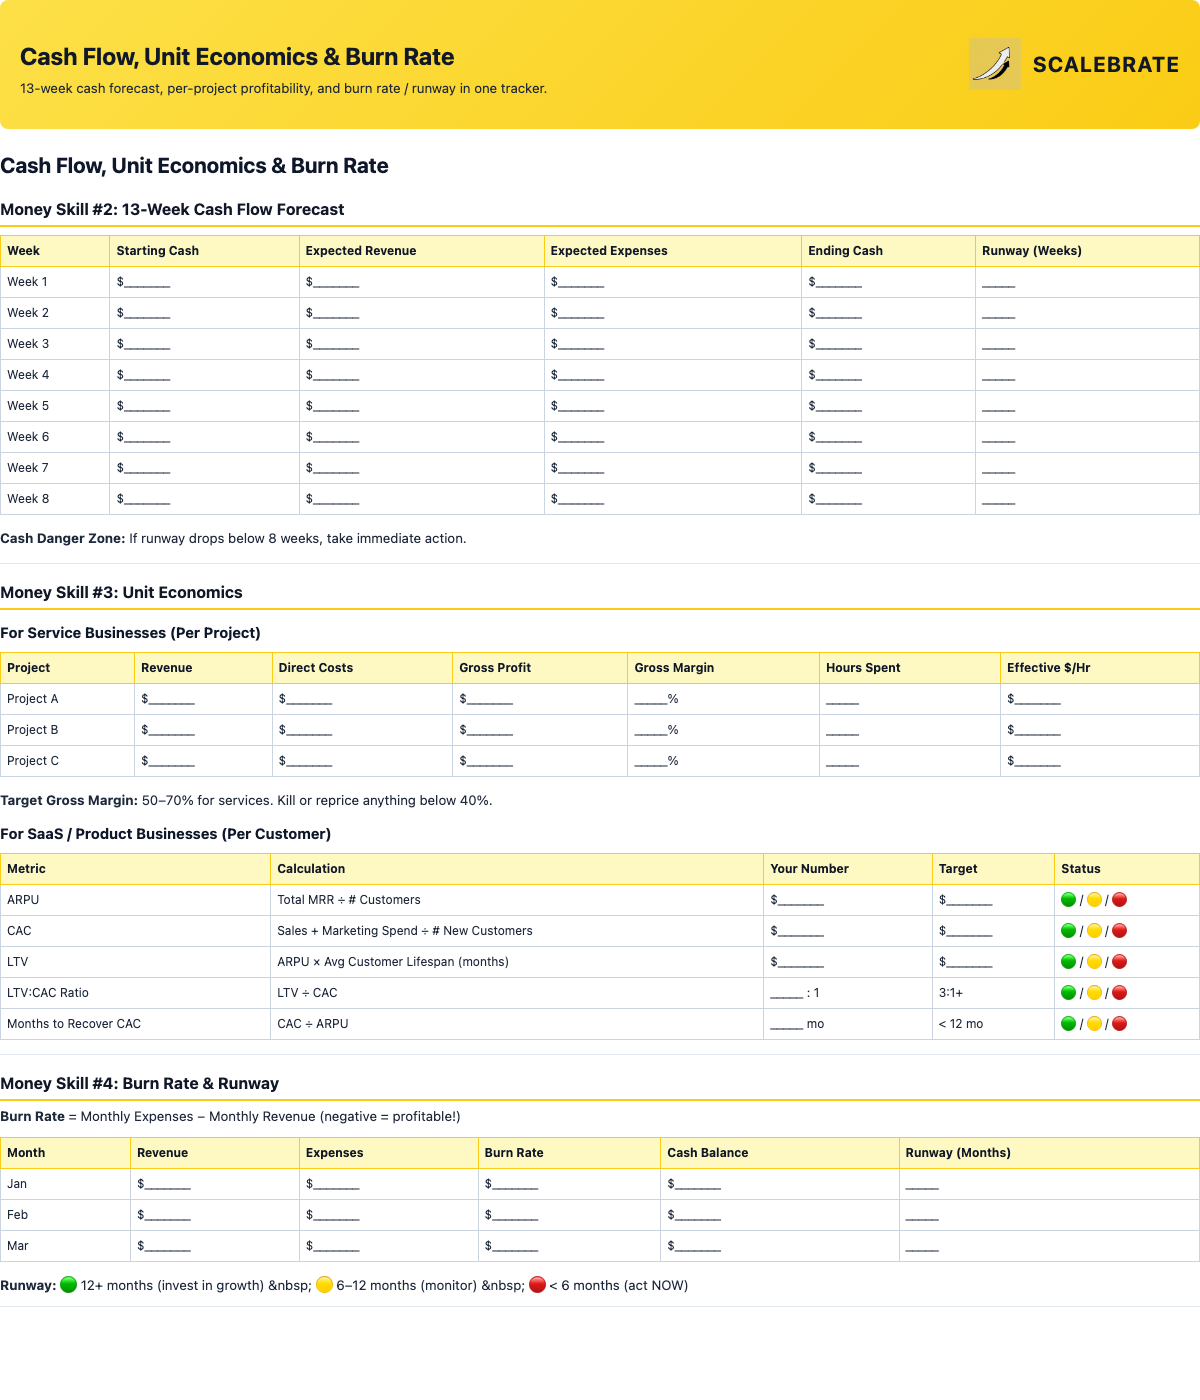
13-week forecast, per-project margins, and burn rate in one place.
peopleBudget, Customer Risk & AR Aging
Know exactly where money is going (budget vs. actual), flag dangerous customer concentration before it becomes a vulnerability, and track who owes you money.
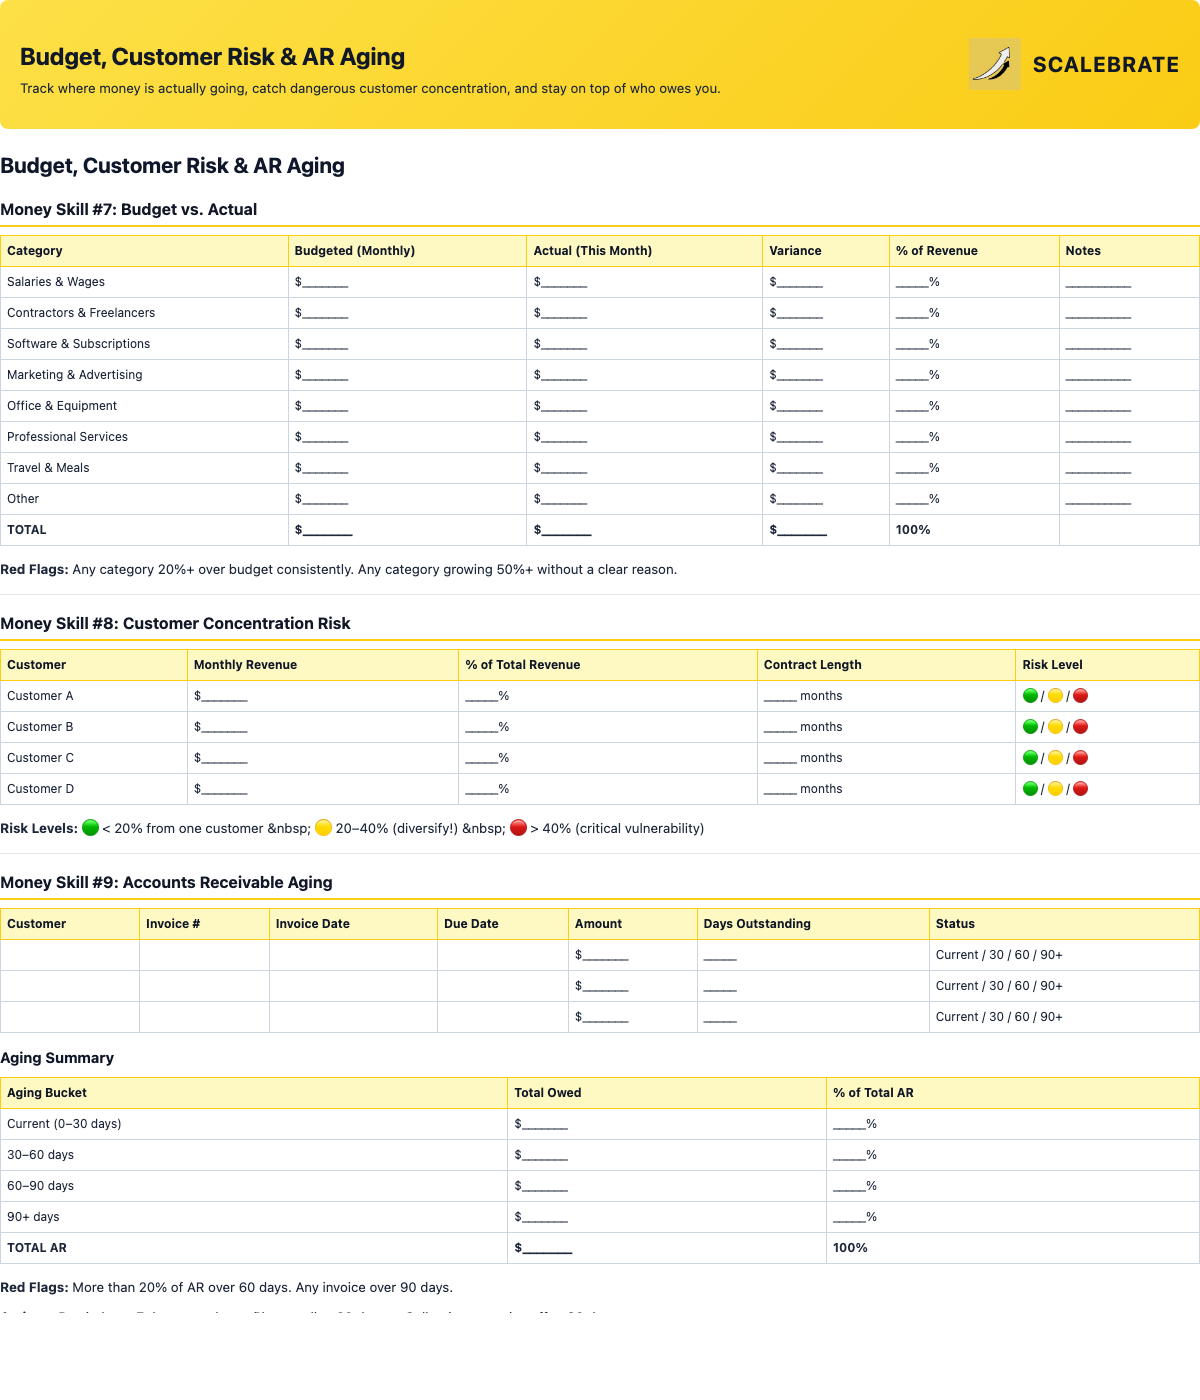
Budget tracking, concentration risk, and AR aging in one tracker.
calendar_monthMonthly Money Skills Review
A 15-minute scorecard on the 1st of every month — all 10 money skills, status colors, and next-month priorities. Includes automation recipes for QuickBooks, Stripe, and bank imports.
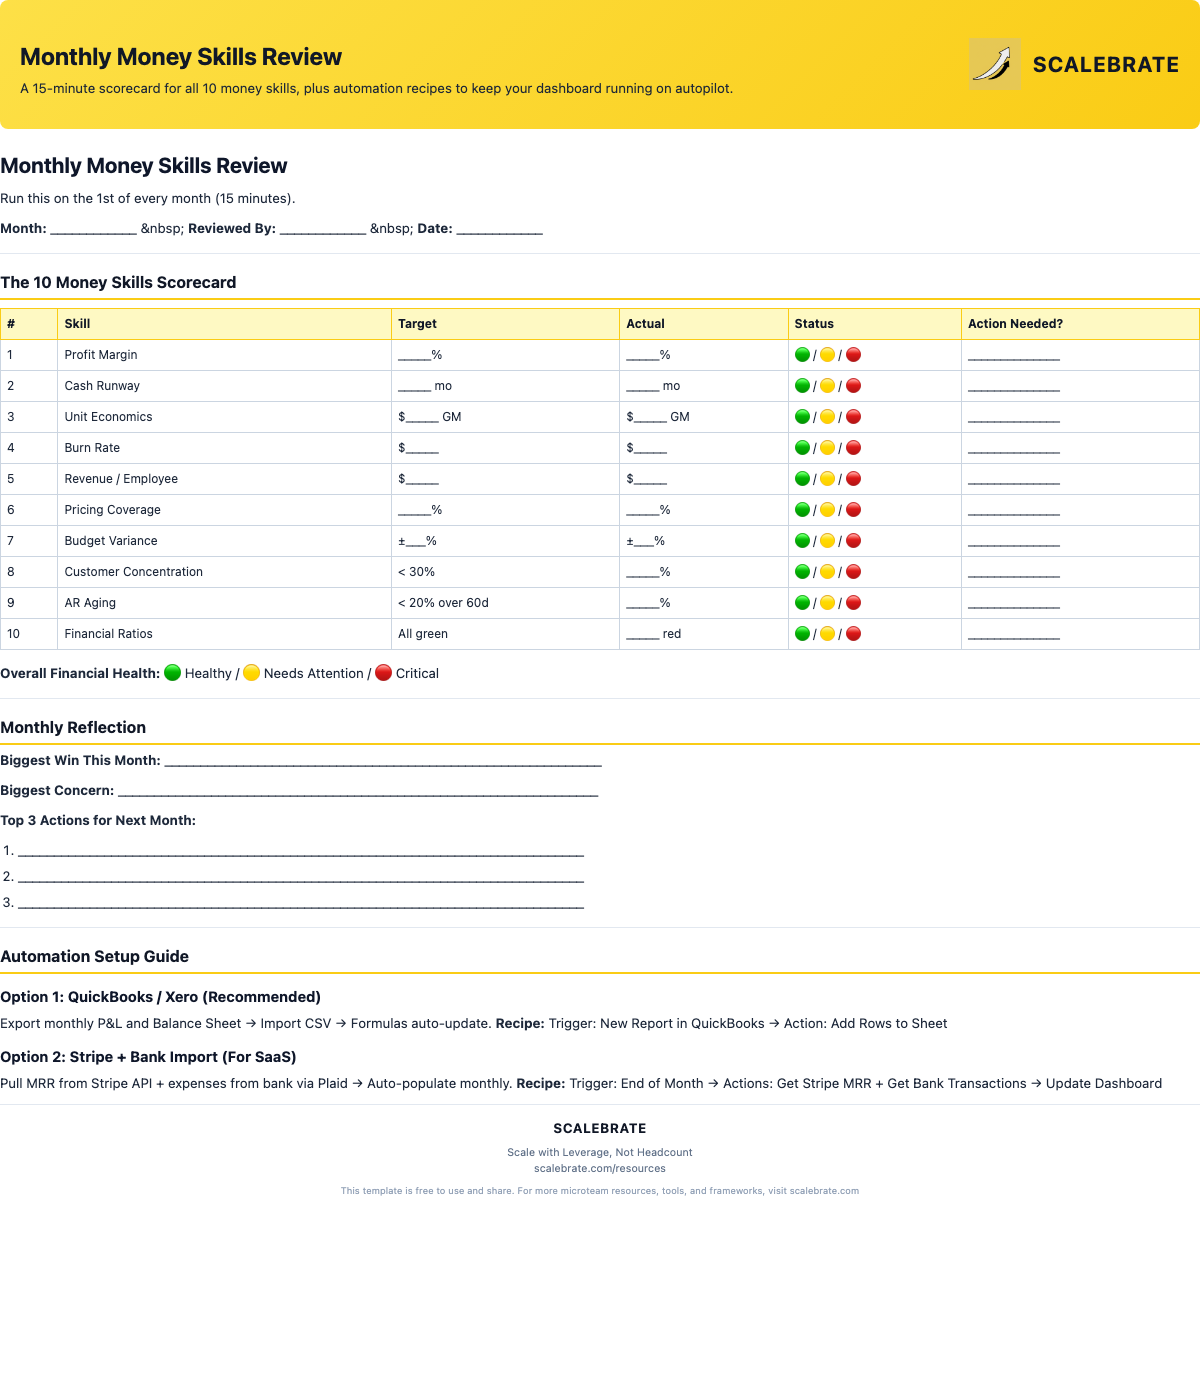
Score all 10 money skills and set next month's action priorities.
history_eduExample: How DesignFlow Doubled Their Profit
Company: DesignFlow (5-person design agency) Founder: Zara
Before the Dashboard: No idea what profit margin was. Surprised by cash crunches every 2–3 months. Pricing was gut feel. Didn't know which clients were profitable.
- chevron_right
Month 1 Insights: Profit margin only 12% (target: 20%). Customer concentration at 47% — critical vulnerability. Two projects had negative margins. $18K sitting unpaid 60+ days.
- chevron_right
Actions: Raised prices 18% for new clients. Stopped low-margin web design work. Switched to Net-15 terms. Started weekly AR follow-ups.
- chevron_right
6-Month Results: Profit margin 22%. Largest client now 28% of revenue. All projects 50%+ gross margin. 95% of invoices paid within 30 days.
Impact: Same revenue ($240K/year). Profit increased from $28.8K to $52.8K (+83%).
Tip 1: Review Weekly for the First 3 Months — Monthly reviews are great once you're dialed in. But when you're first setting up, check the dashboard weekly to spot patterns faster.
Tip 2: Set Alerts for Red Flags — Use conditional formatting in Google Sheets or Airtable to auto-highlight red metrics. If runway drops below 6 months, get an email alert.
Tip 3: Share Relevant Metrics With Your Team — Financial literacy isn't just for founders. Share profit margin and revenue per employee so everyone understands how the business works.