
What This Is: A 3-part financial dashboard kit with a daily executive summary, revenue and expense tracking with formulas, a 13-week cash flow forecast, P&L analysis, an 8-KPI dashboard, automation recipes, and alert thresholds. Designed to know your numbers every day — not every month — and catch cash problems before they hit.
warningWhy You Need This
Waiting until month-end to know if you're profitable is like driving with your eyes closed. Most micro-business founders check their finances reactively — when something goes wrong. By then, it's too late to course-correct.
This kit gives you a real-time view of revenue, expenses, cash flow, and profitability updated daily. With pre-built formulas, automated import recipes, and a traffic-light alert system, you'll know exactly where your business stands — every single morning.
lightbulbHow to Use This Kit
- counter_1
Set Up Your Executive Summary (Part 1): Configure the one-page overview with your targets and status thresholds. This is your daily 5-minute check.
- counter_2
Log Revenue Daily (Part 1): Enter each transaction by source and category. The formulas auto-calculate averages, growth rates, and month-end projections.
- counter_3
Track Expenses & Cash Flow (Part 2): Log expenses daily, run your 13-week cash flow forecast weekly, and use the P&L and per-product margins to cut losers and grow winners.
- counter_4
Monitor KPIs & Alerts (Part 3): Check the 8-KPI dashboard for trend direction, set up automation recipes for hands-off data import, and configure alert thresholds to catch problems early.
summarizePart 1: Executive Summary & Revenue Tracking
A one-page financial status dashboard with traffic-light alerts across 7 key metrics, a daily revenue log with source and category tracking, and pre-built formulas for average daily revenue, growth rate, and month-end projections.
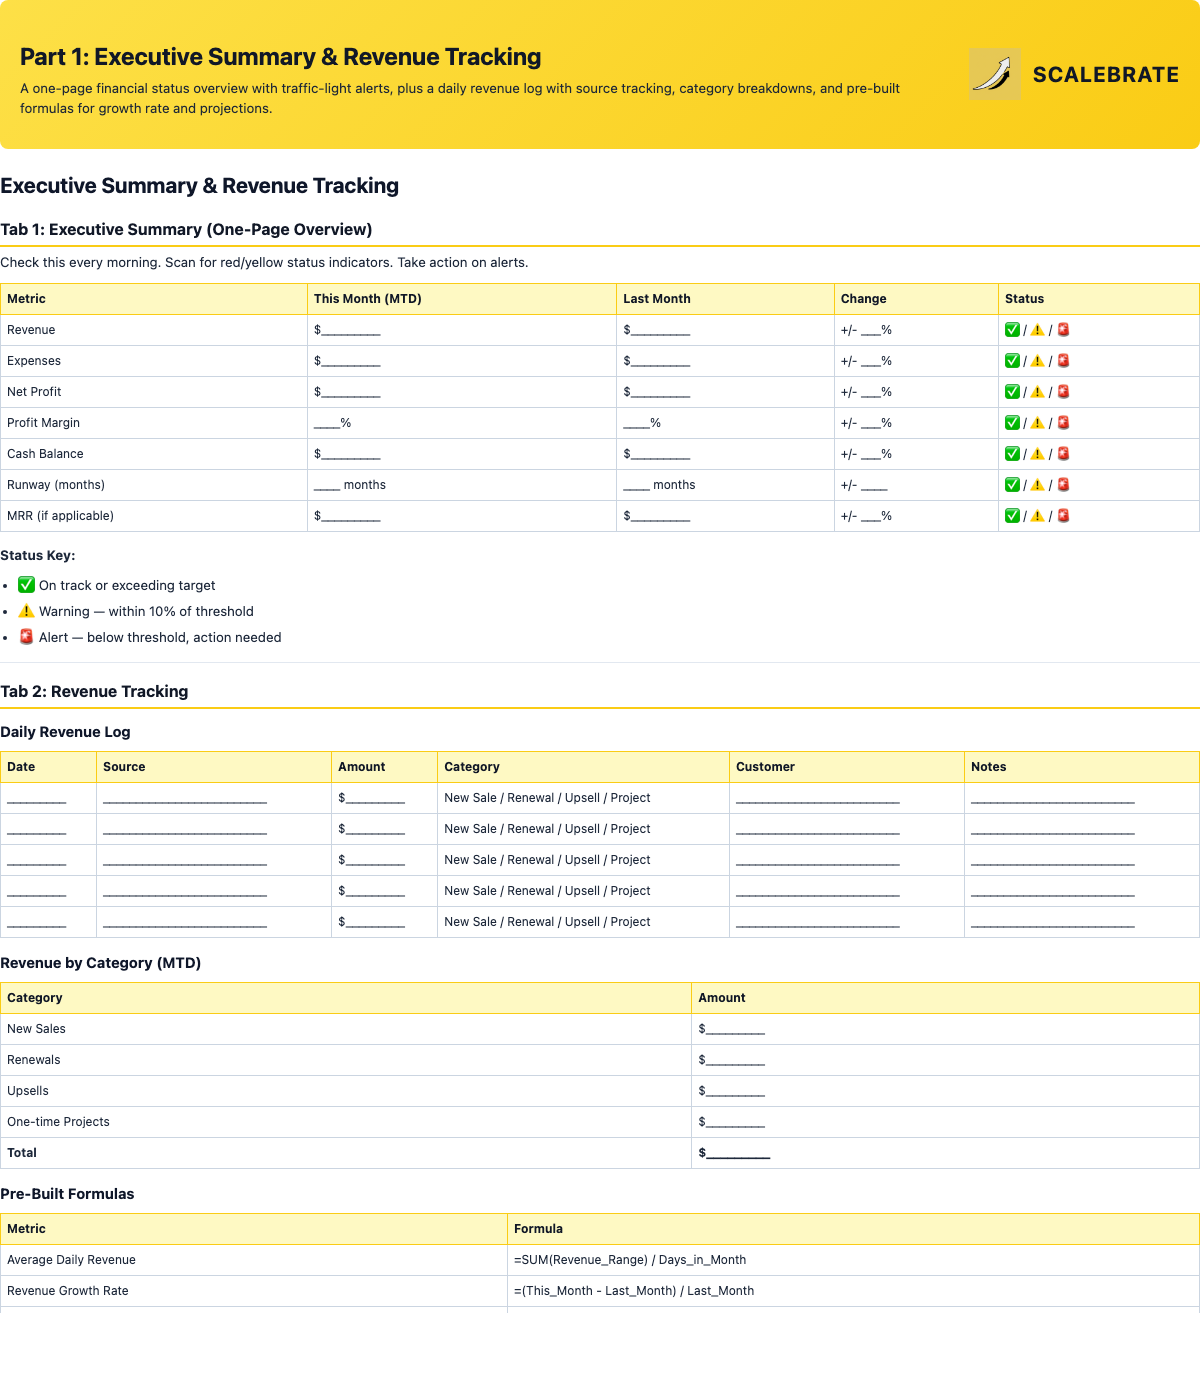
7-metric executive summary with status indicators, daily revenue log by source, category breakdown, and 3 pre-built formulas.
account_balancePart 2: Expense Tracking, Cash Flow Forecast & Profitability Analysis
A categorized expense log with fixed/variable breakdown and burn rate formula, a 13-week cash flow forecast with weekly alert triggers, and a full P&L summary with per-product margin analysis and clear keep/review/cut decision rules.
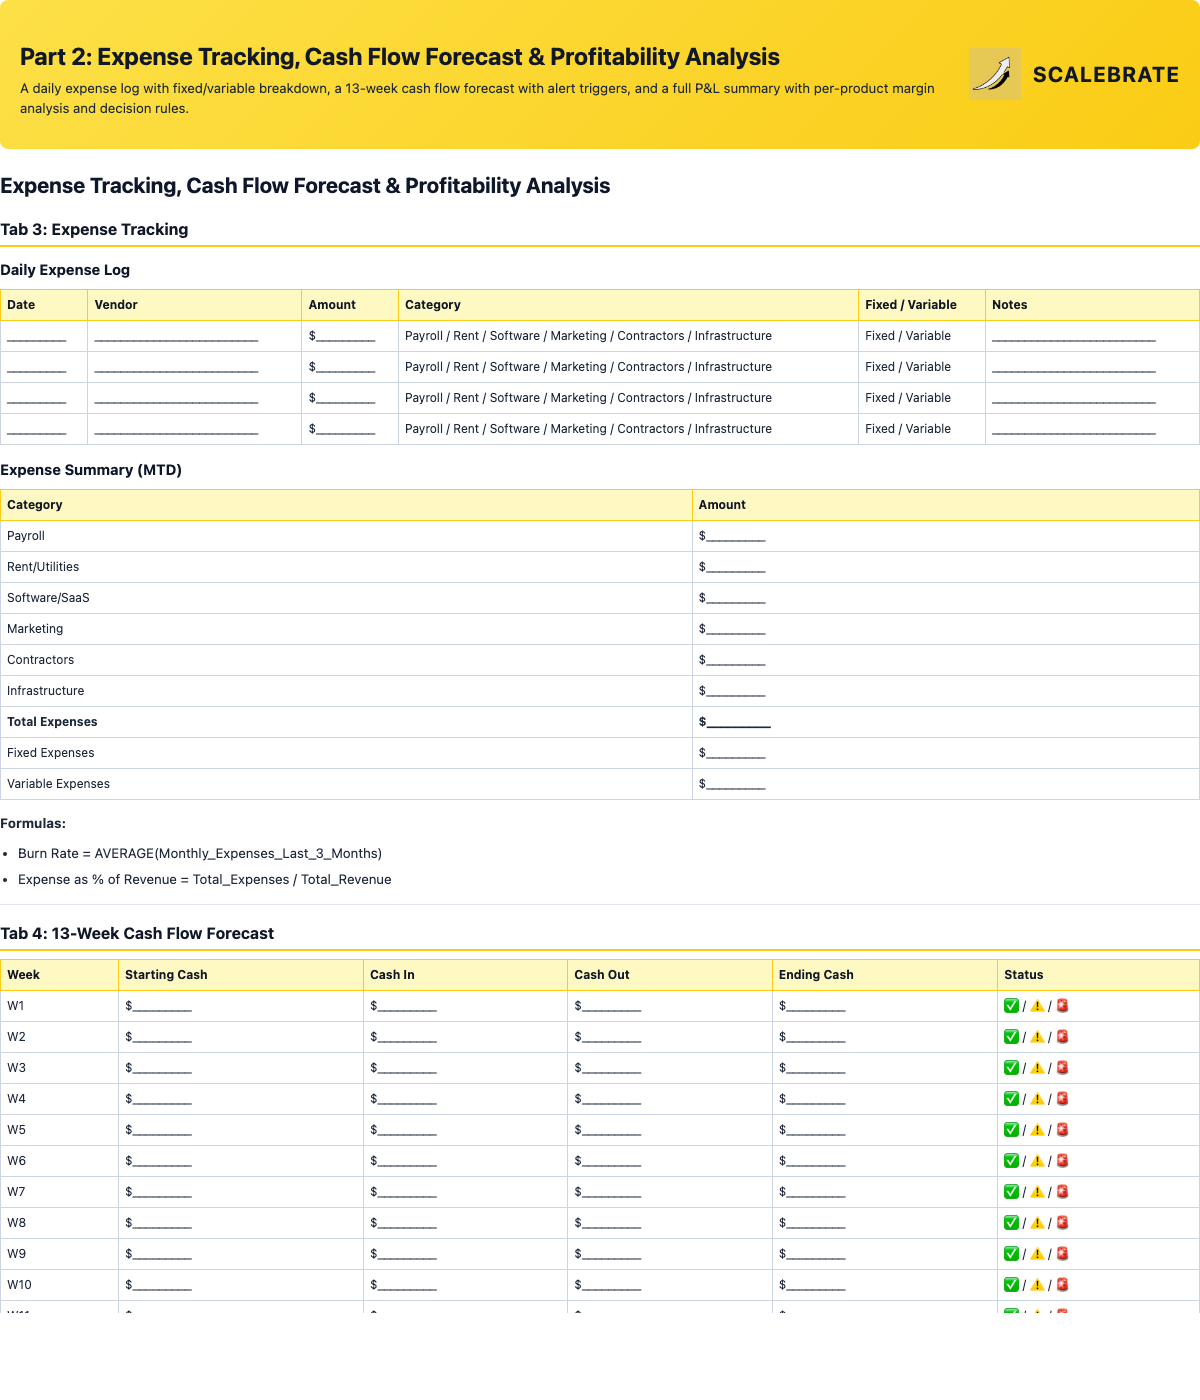
6-category expense log, 13-week cash flow forecast with alert triggers, P&L summary, and per-product margin decision rules.
dashboardPart 3: KPI Dashboard, Automation Recipes & Alert System
An 8-KPI dashboard with pre-built formulas and trend indicators, 4 automation recipes for Stripe/PayPal/bank integration, 4 business-model-specific metric sets (SaaS, Service, E-Commerce, Agency), and a full alert threshold system across cash, revenue, expenses, and runway.
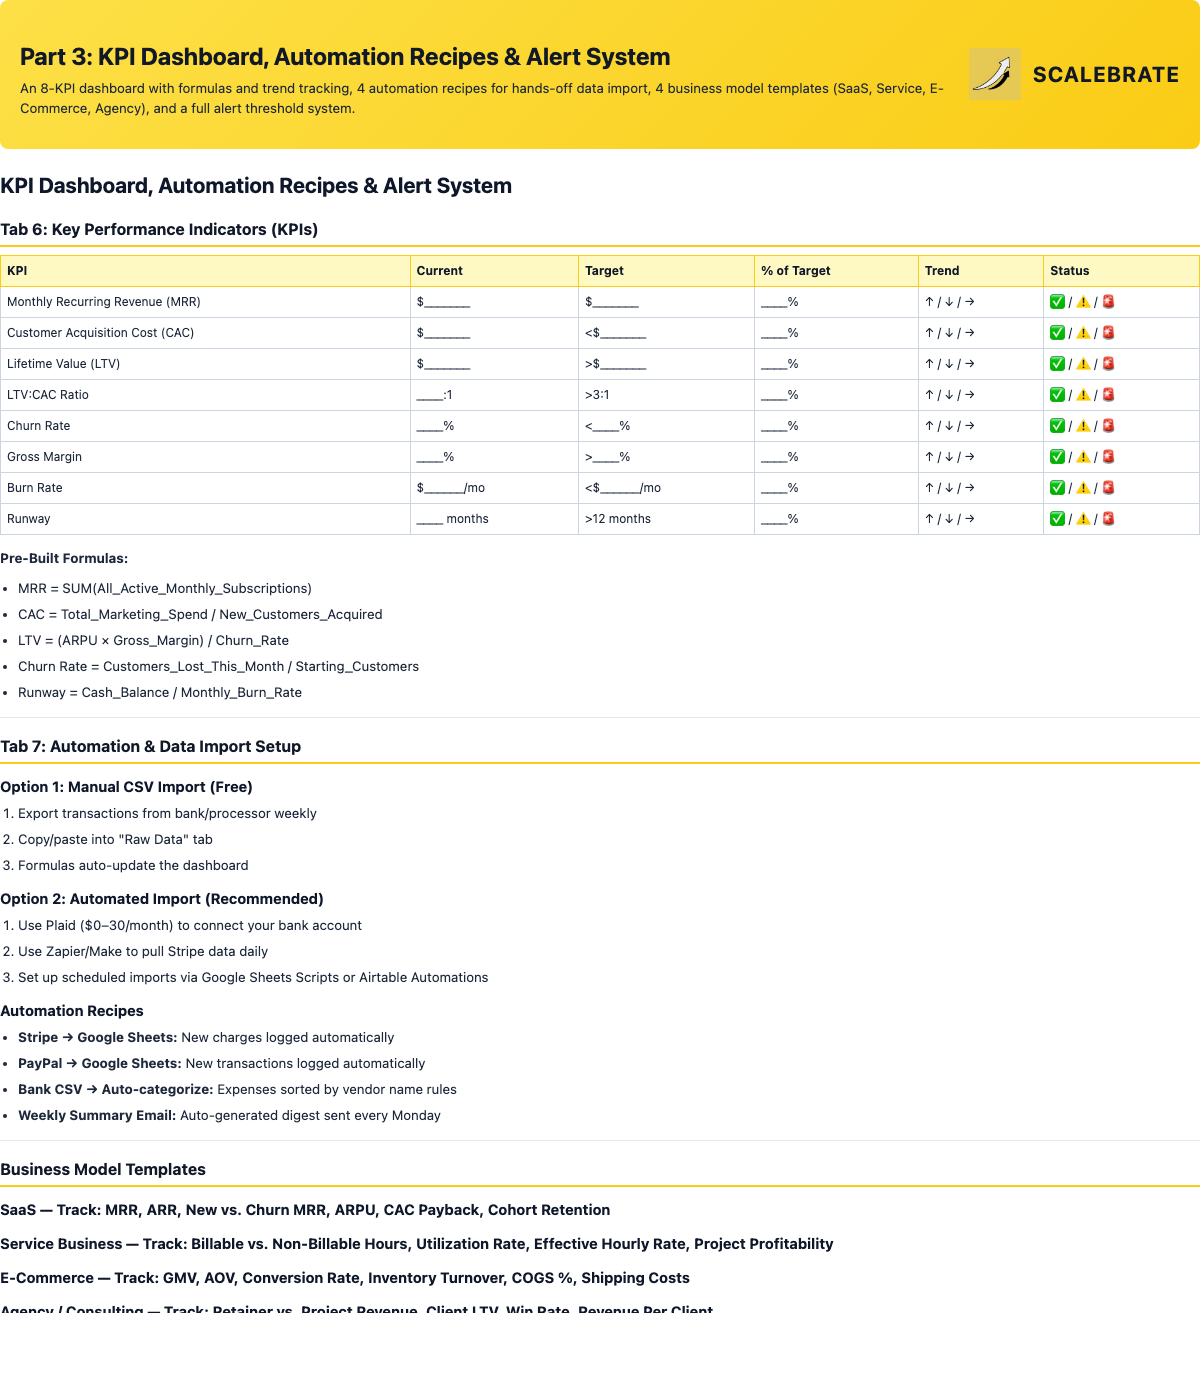
8-KPI dashboard with formulas, 4 automation recipes, business model templates, and a 4-category alert threshold system.
Tip 1: Review Daily, Act Weekly — Spend 5 minutes each morning scanning the Executive Summary. Reserve time weekly to respond to trends and adjust forecasts.
Tip 2: Set Up Conditional Formatting Immediately — Green for exceeding target, yellow for within 10% of threshold, red for below. Problems become instantly visible.
Tip 3: Automate Before You Optimize — The more manual data entry you require, the less likely the dashboard stays updated. Automation recipes come first.
Tip 4: Share Selectively With Your Team — Give each person a filtered view showing only the metrics they can influence: customer success sees churn, sales sees CAC and win rate.